Every panel, inspected by AI.
Valorin turns drone, thermal, and IV-curve data into actionable fault reports — automatically. AI agents triage your fleet, write the work orders, and tell your crew exactly where to go.
Four steps. Zero spreadsheets.
Connect your data
Drone imagery, SCADA, IV curves, CMMS — Valorin pulls from whatever you already have.
Agents go to work
Vision, thermal, and electrical agents inspect every module in parallel — at scale.
Prioritized queue
Findings ranked by yield impact and ROI. Your morning standup runs itself.
Crews dispatched
Work orders auto-routed. Valorin closes the loop when the fix lands.
The Digital Twin for Scale.
Live Fleet Tracking
The inspection begins here. Monitor your UAV fleet in real-time as the drone navigates its automated flight path across the solar array, streaming telemetry and GPS data directly back to command.
- • Live UAV flight path monitoring
- • Real-time grid progression
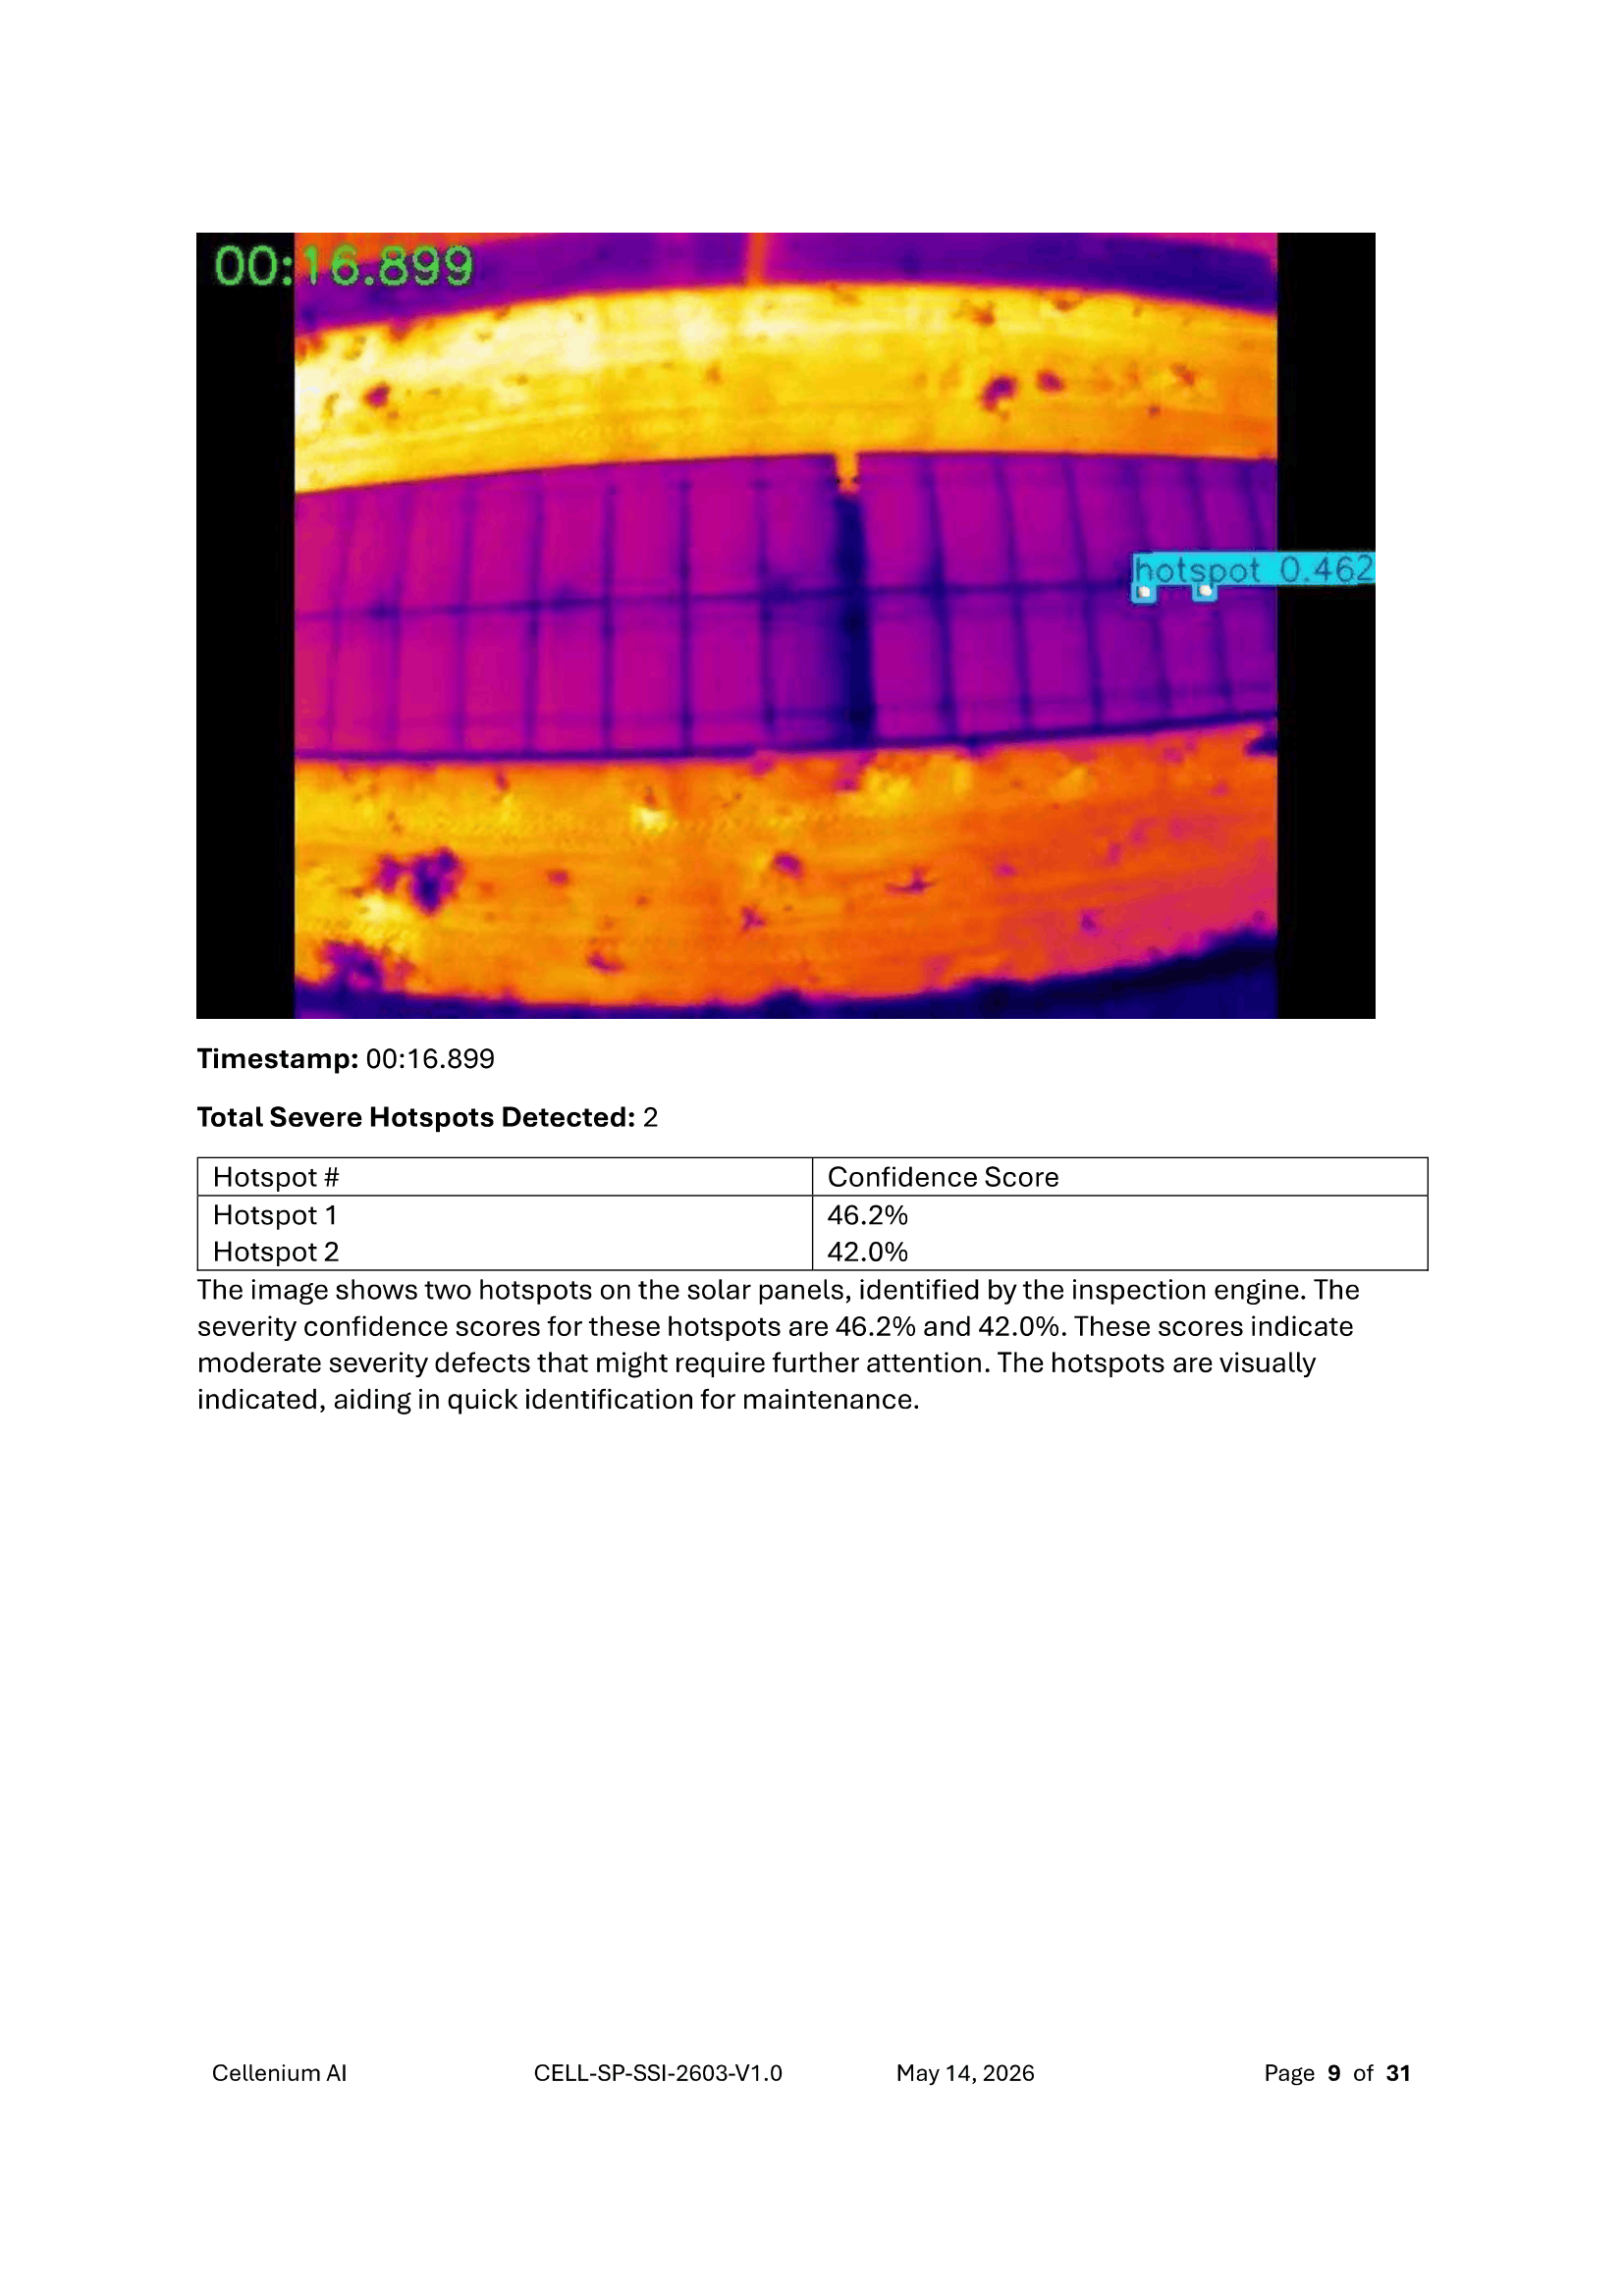
In-Depth Video Analysis
Once the data is captured, playback raw thermal and visual drone footage directly in the browser. Pause, rewind, and let our AI overlay pinpoint exact temperature deltas and confidence scores frame-by-frame.
- • Frame-by-frame AI bounding boxes
- • Synchronized RGB and IR playback
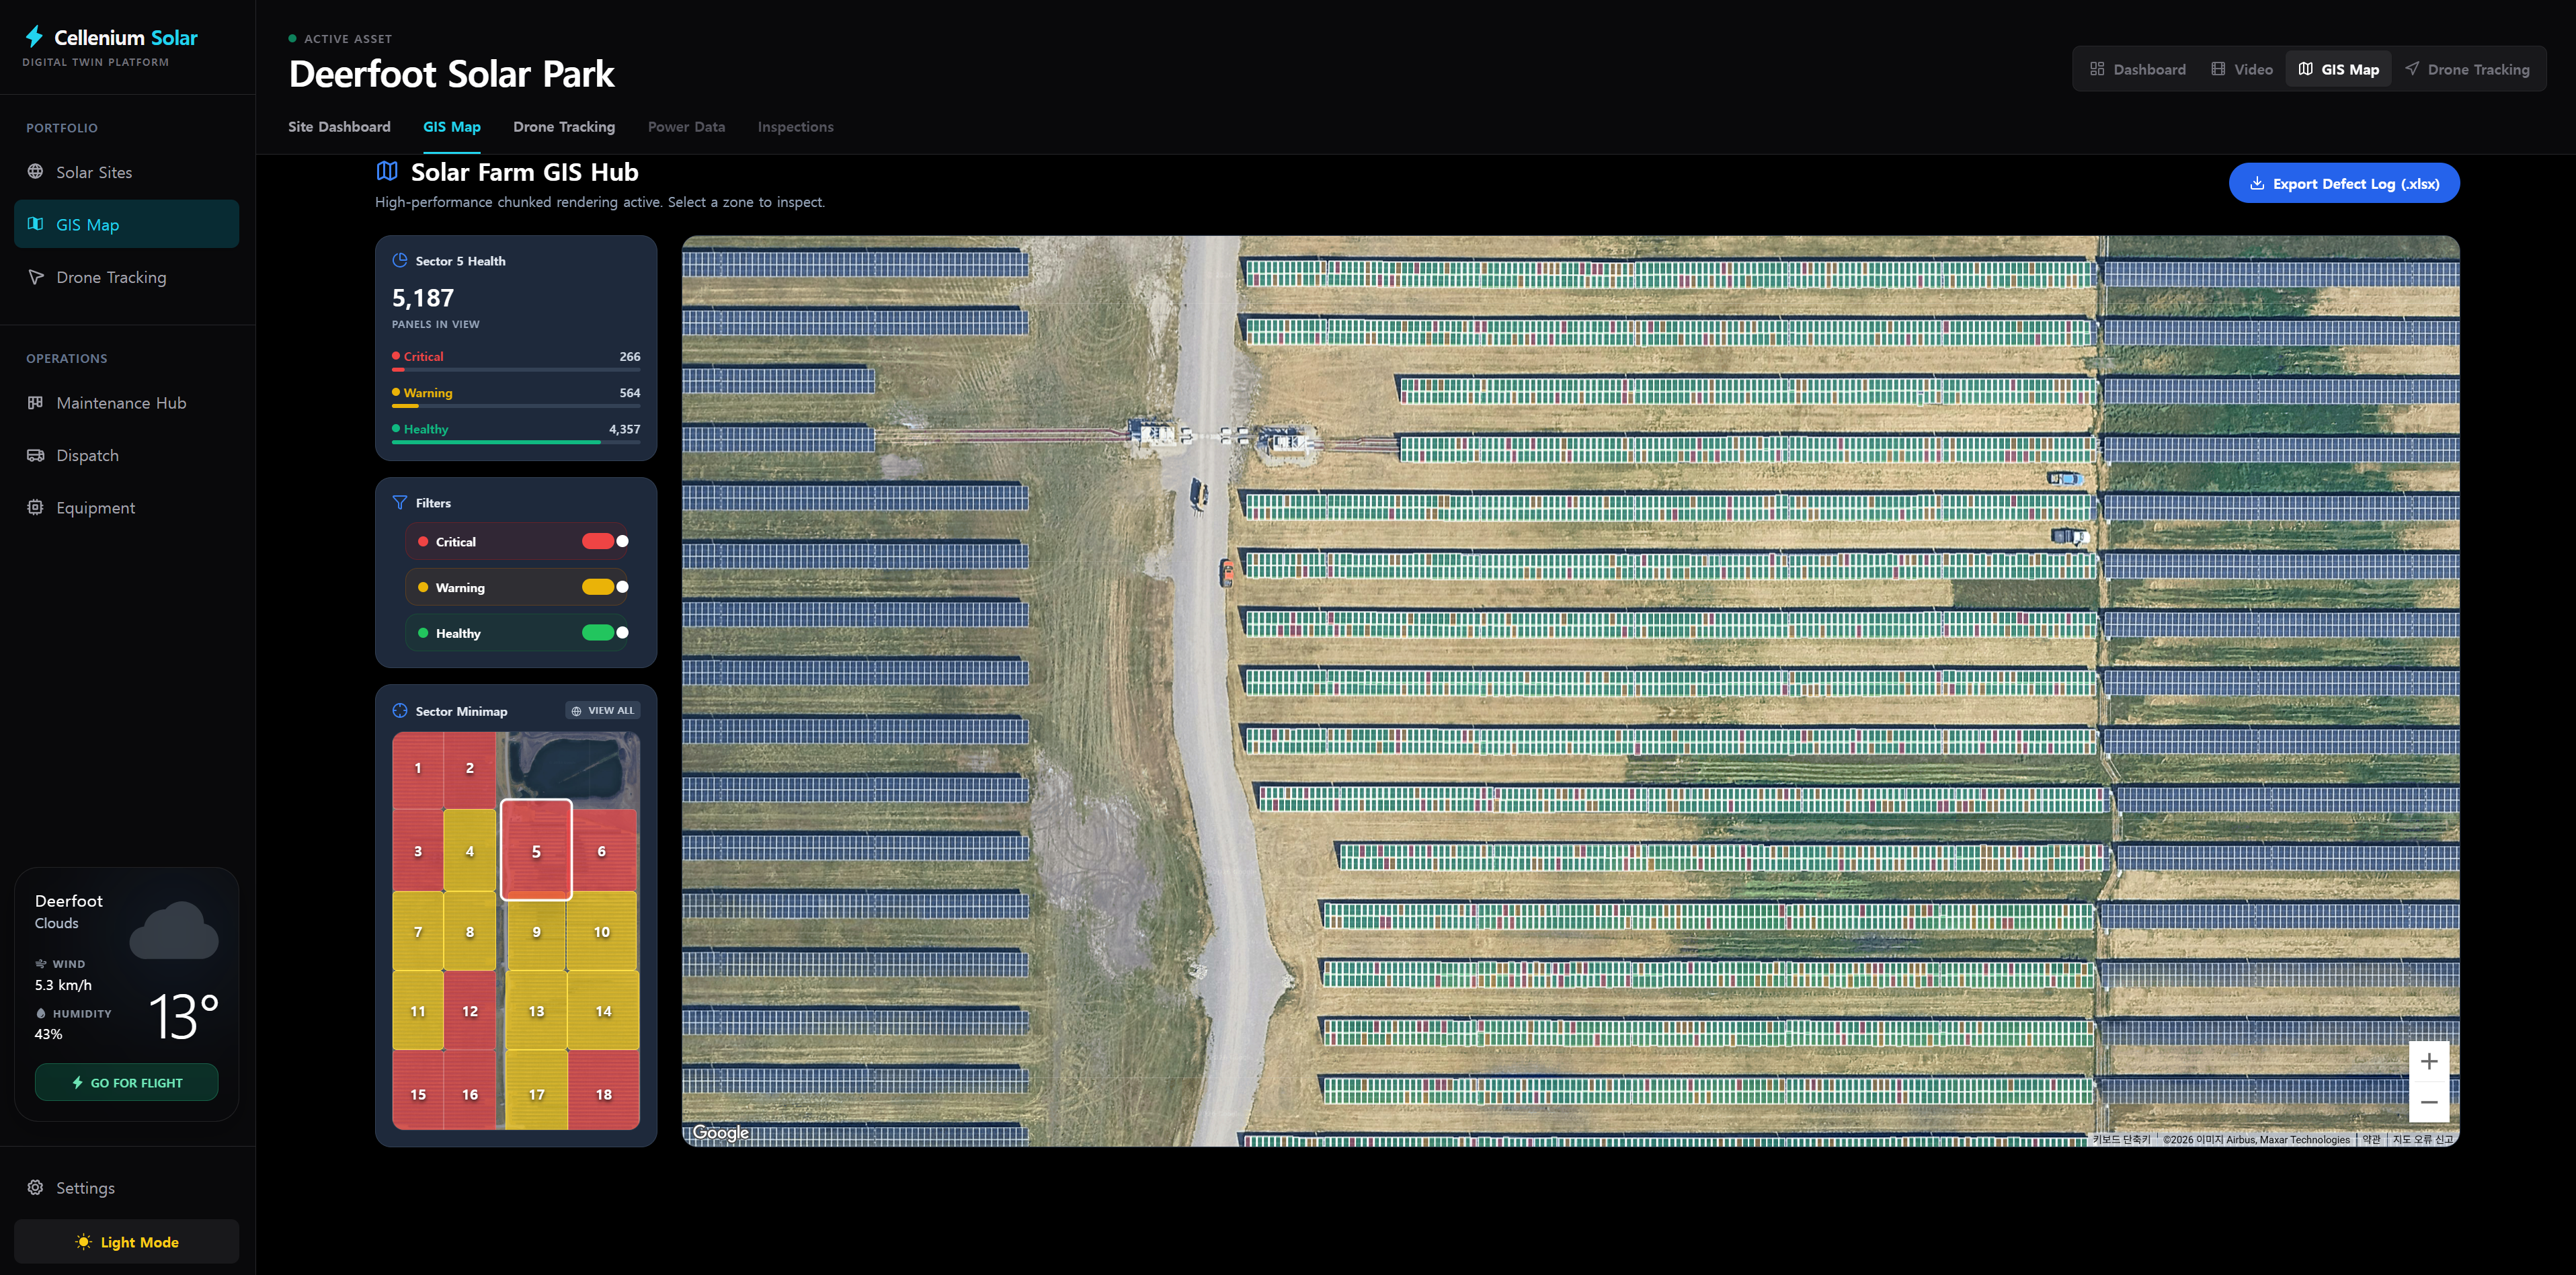
Interactive GIS Map
Those detected anomalies are then mapped to an interactable bird’s eye view of your entire farm. Every panel is color-coded by health status - simply hover to see ID numbers, GPS coordinates, and precise defect types.
- • Panel-level diagnostics & telemetry
- • Sector-based zoom & navigation
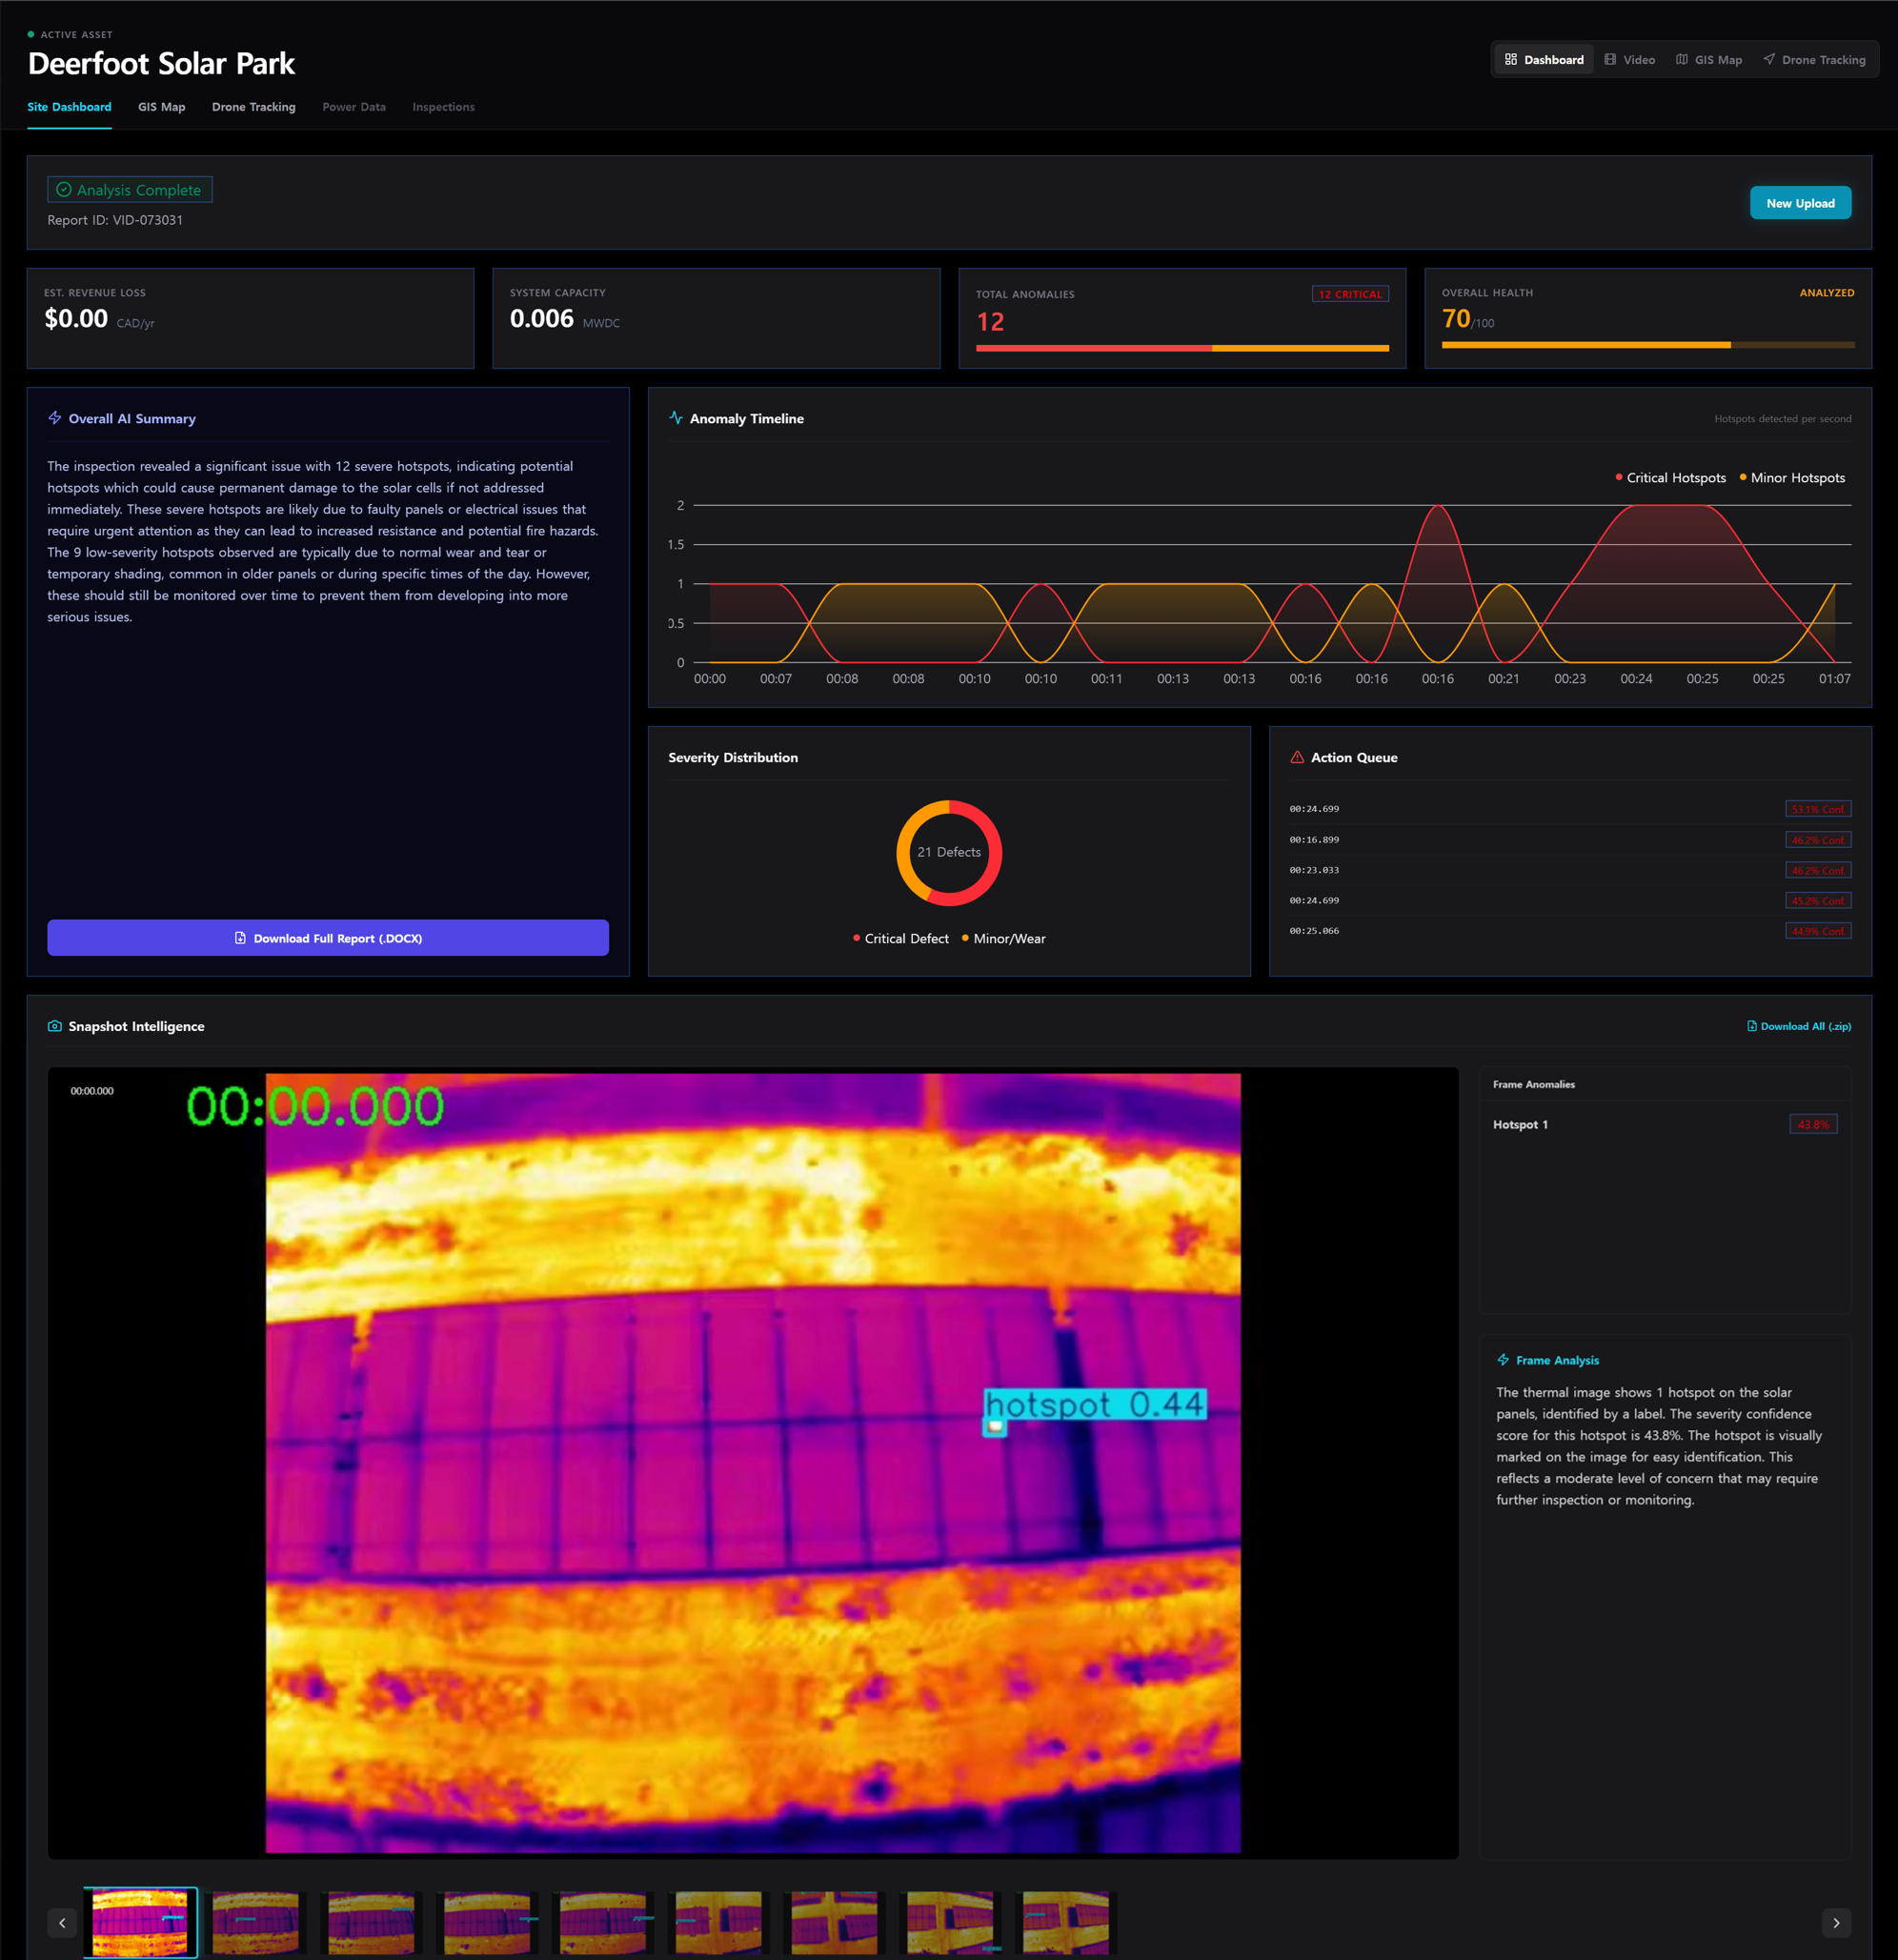
Executive Dashboard
Zoom out to track fleet-wide health at a glance. Our dashboard calculates potential economic losses in real-time and provides AI-generated executive summaries of every inspection scan.
- • Real-time energy loss forecasting
- • Automated daily technology briefings
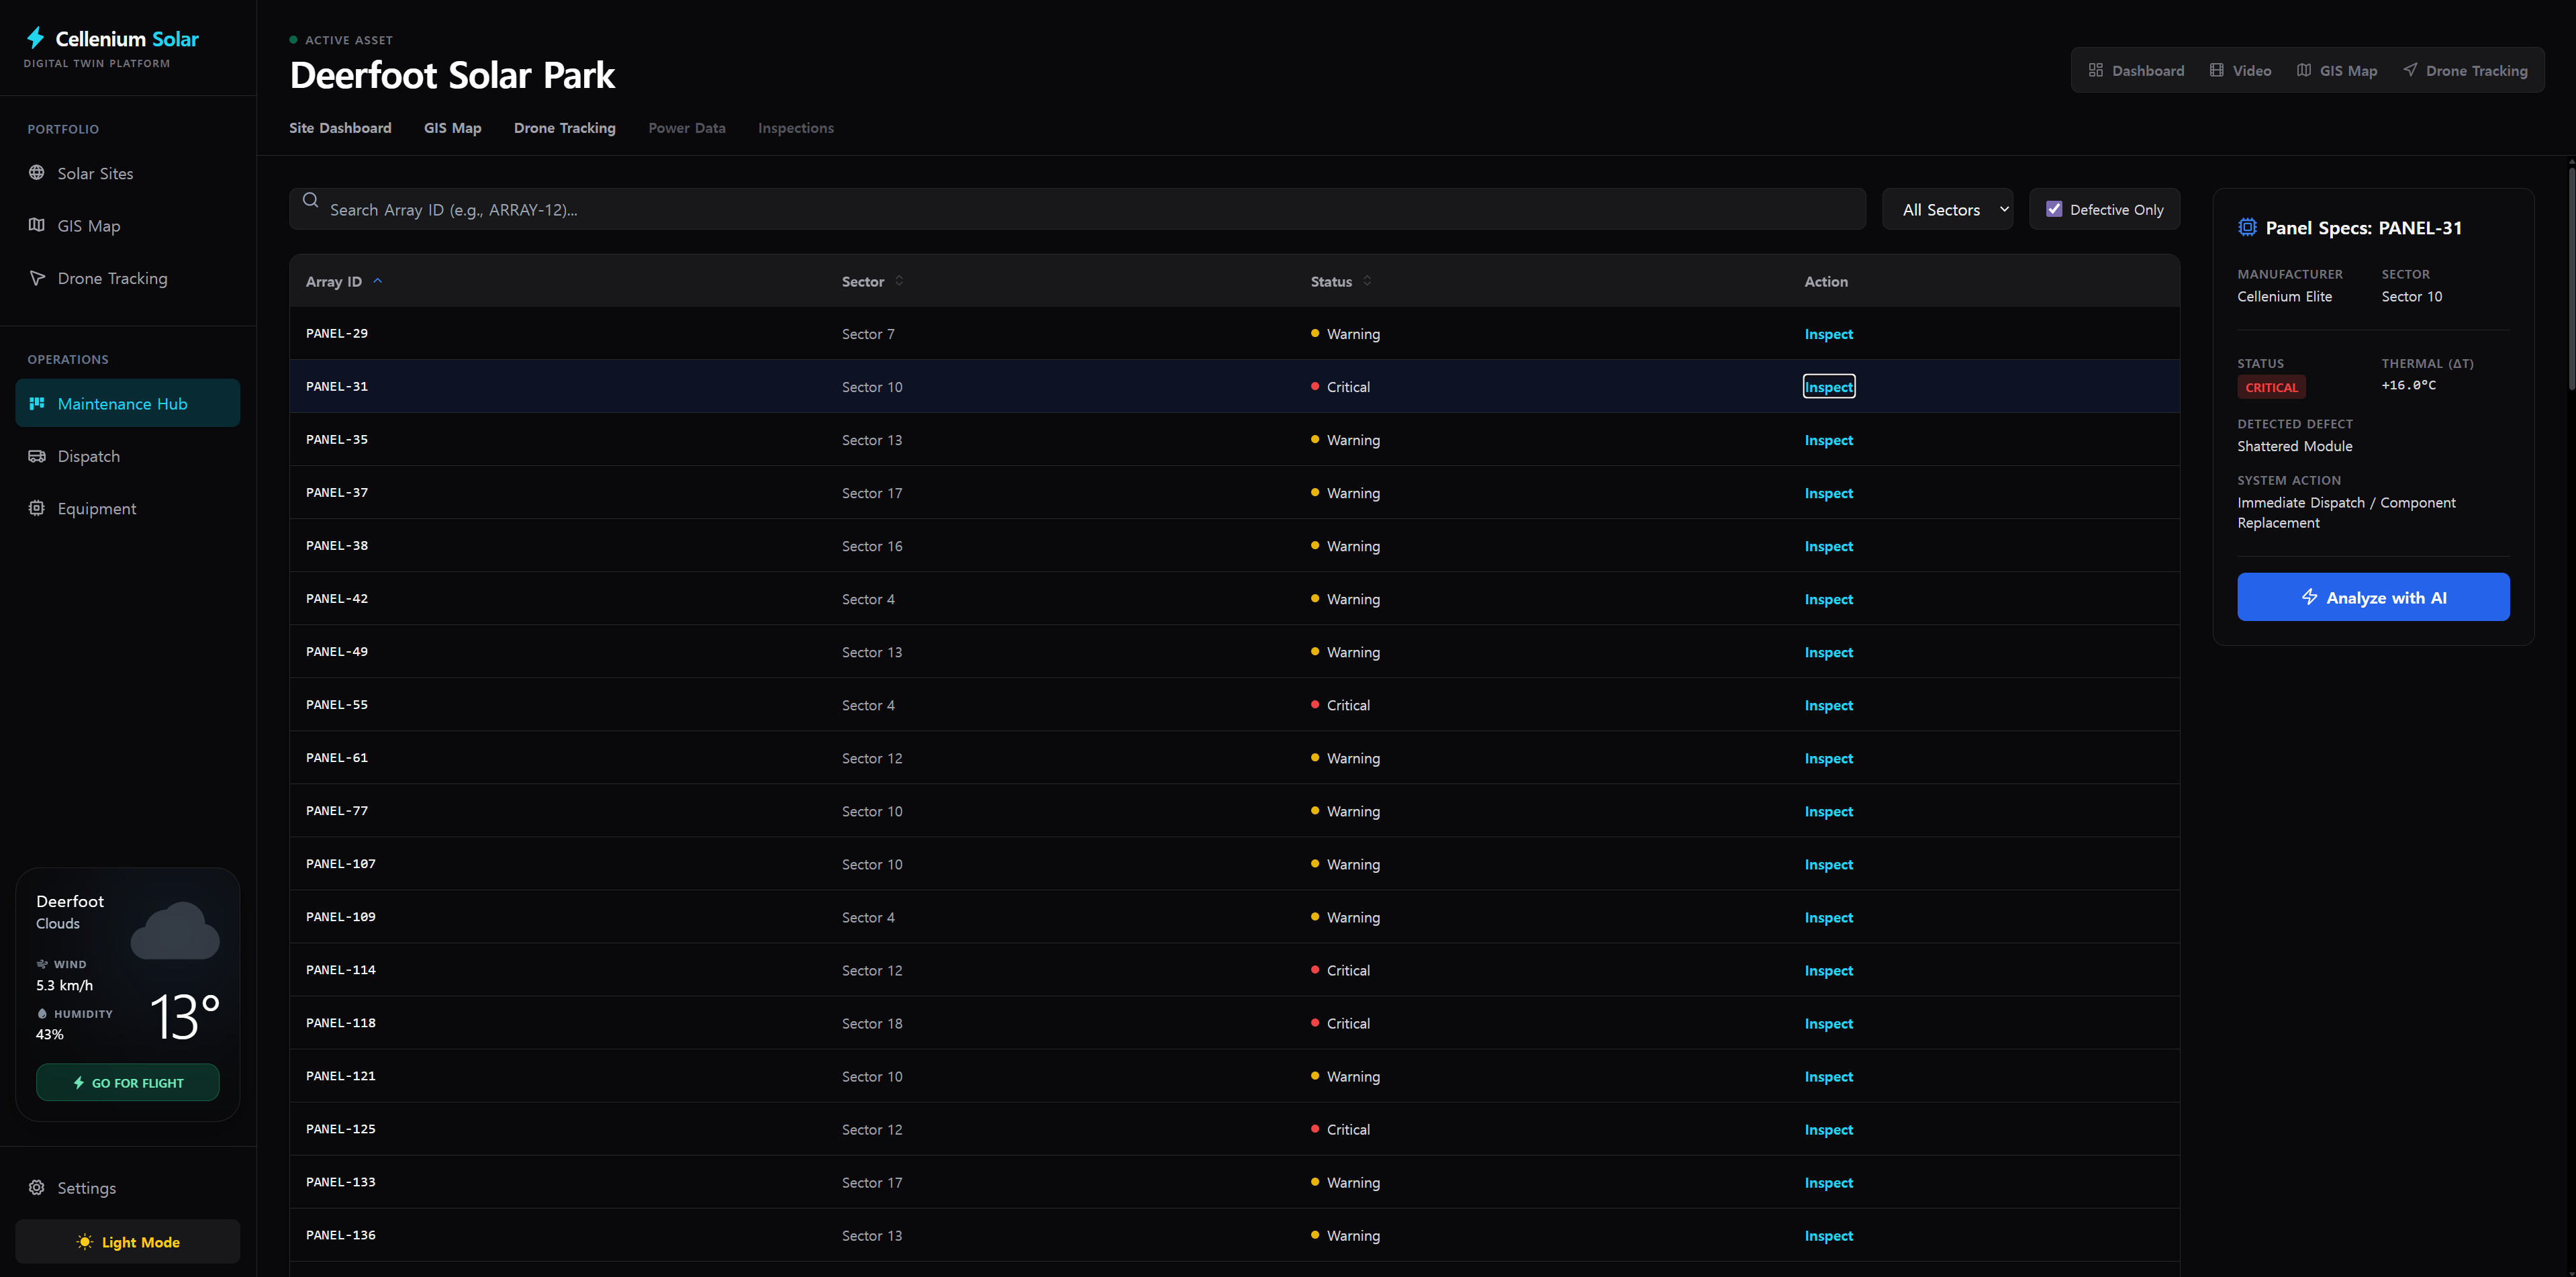
Maintenance & Inventory Hub
Turn insights into action. Close the loop on repairs as our AI agent cross-references defects with your inventory database to find replacement parts and drafts warranty claim emails automatically.
- • Automated warranty claim generation
- • AI-optimized dispatch and logistics
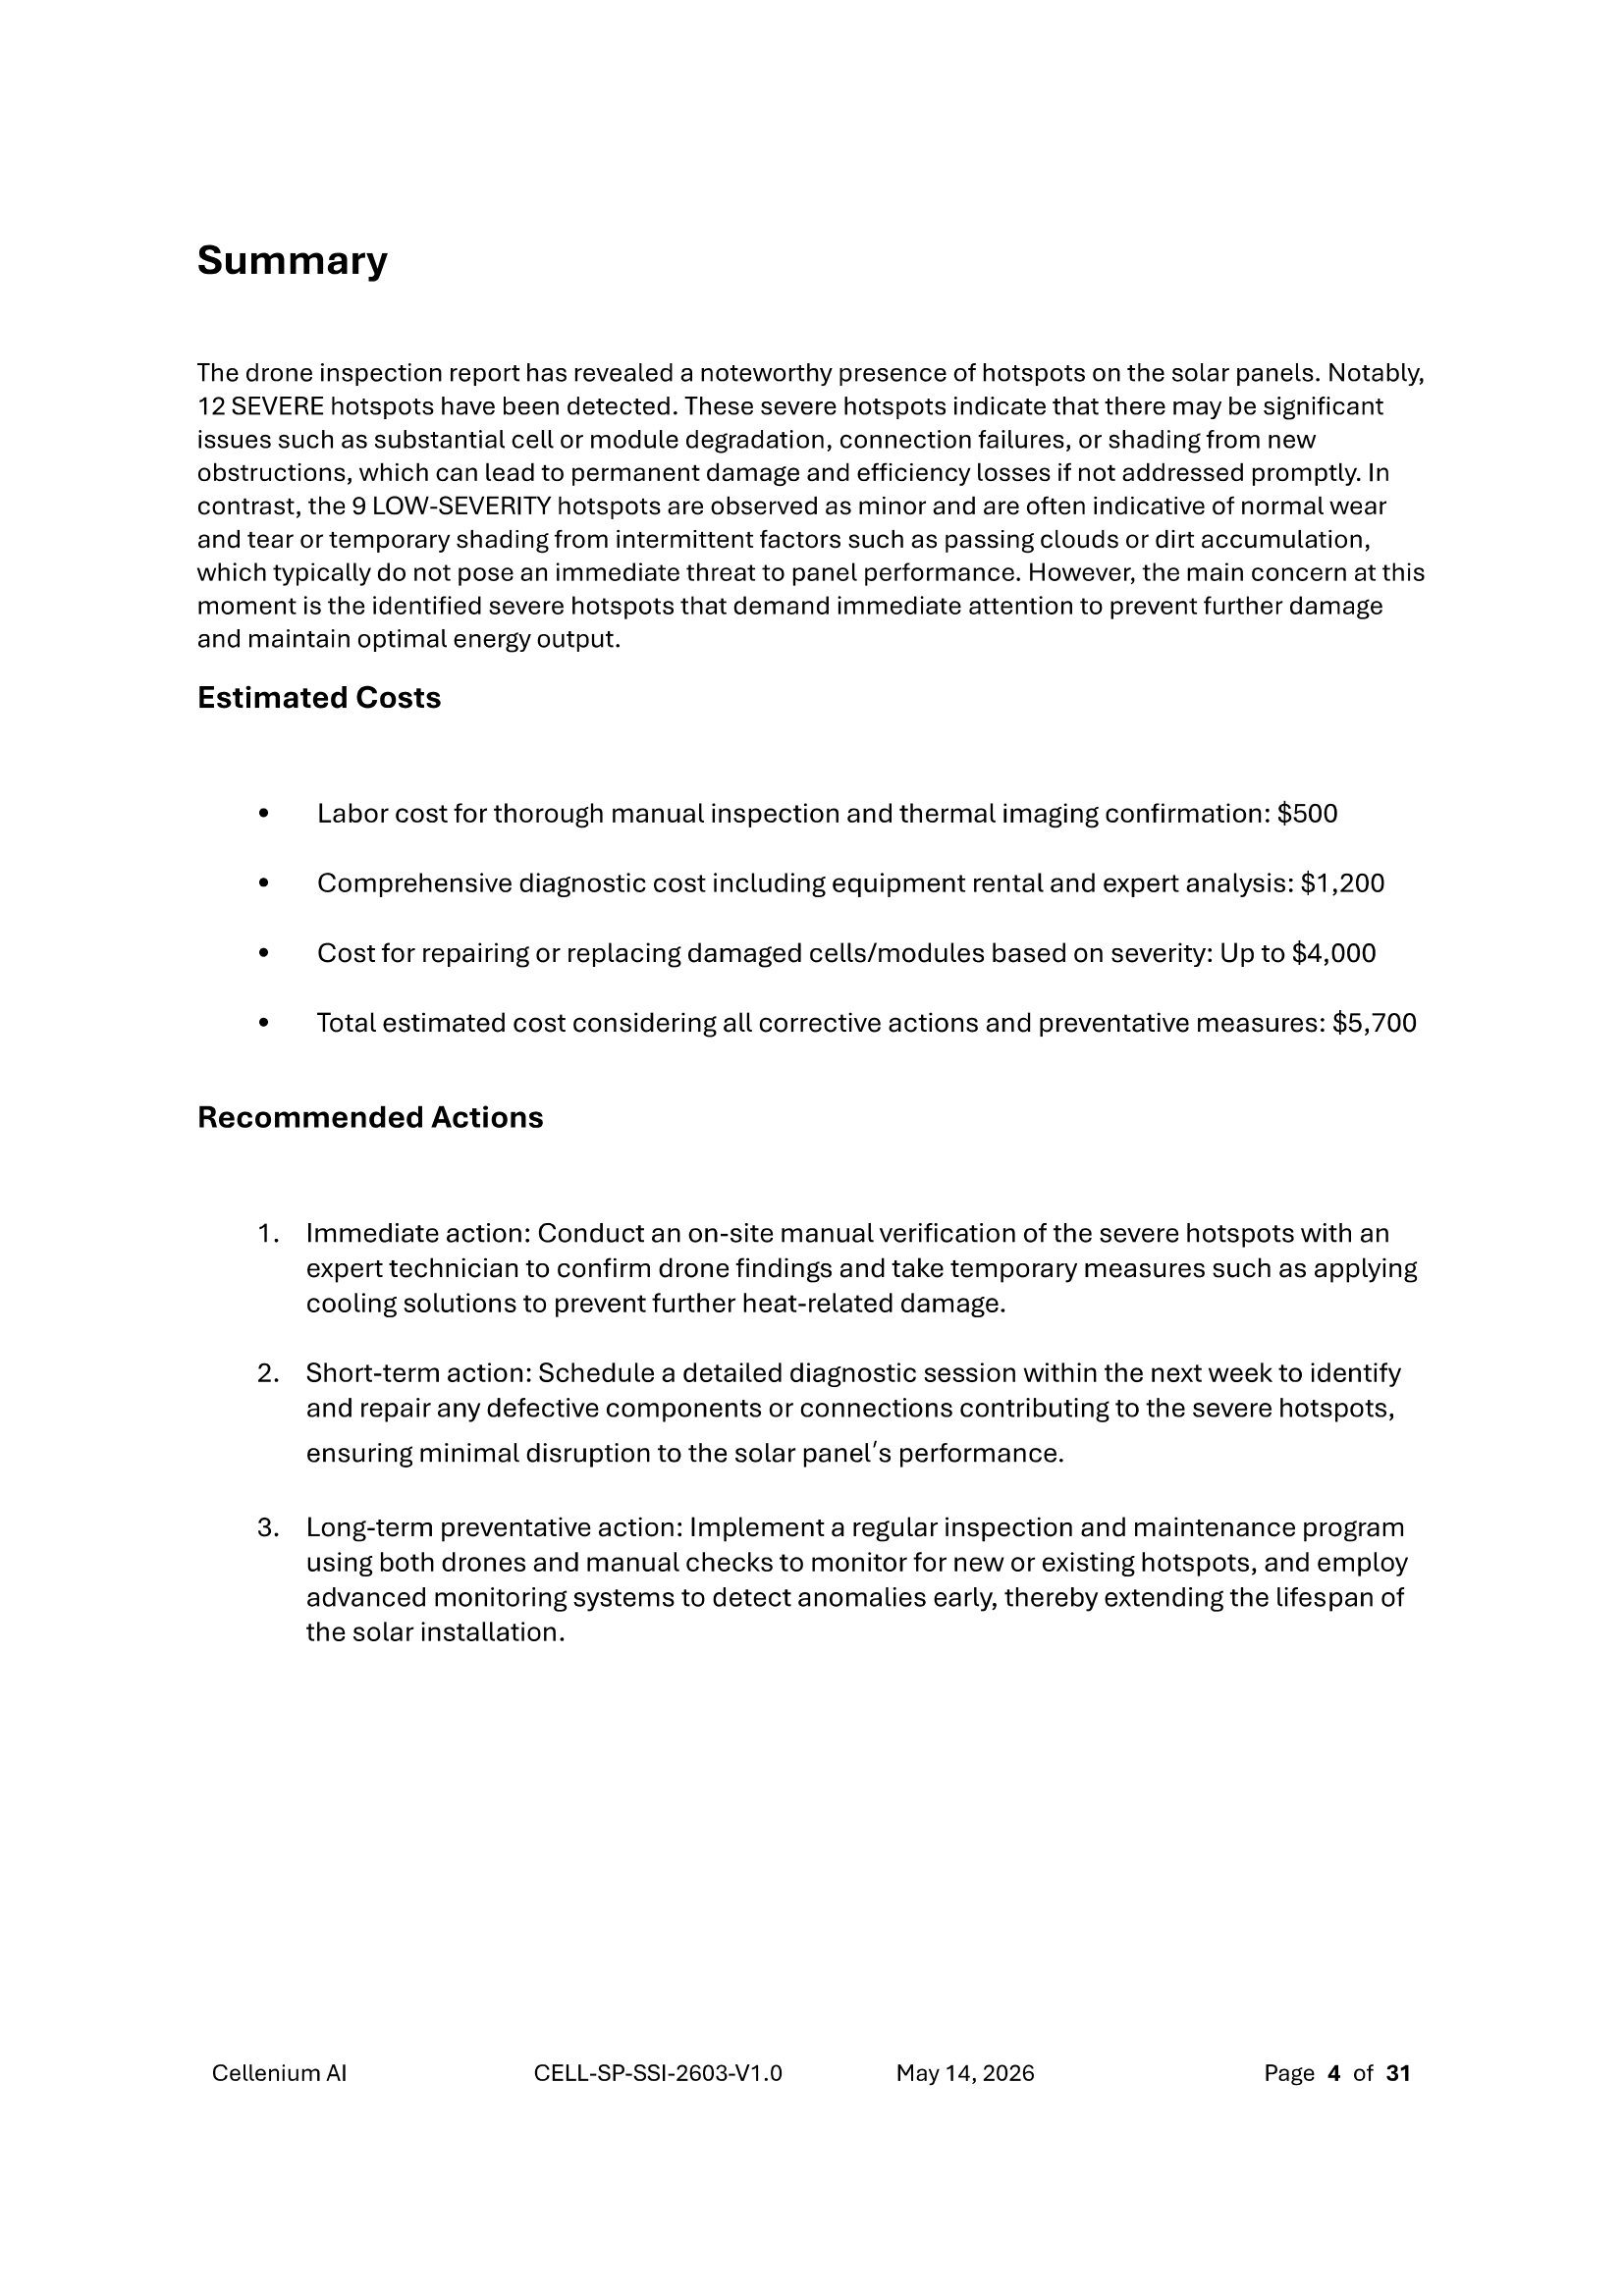
Automated Executive Reports
When the job is done, transform raw inspection data into board-ready PDFs in minutes. Our AI compiles executive summaries, fault statistics, and remediation plans without manual data entry.
- • AI-authored triage summaries
- • Ready-to-send PDF formatting
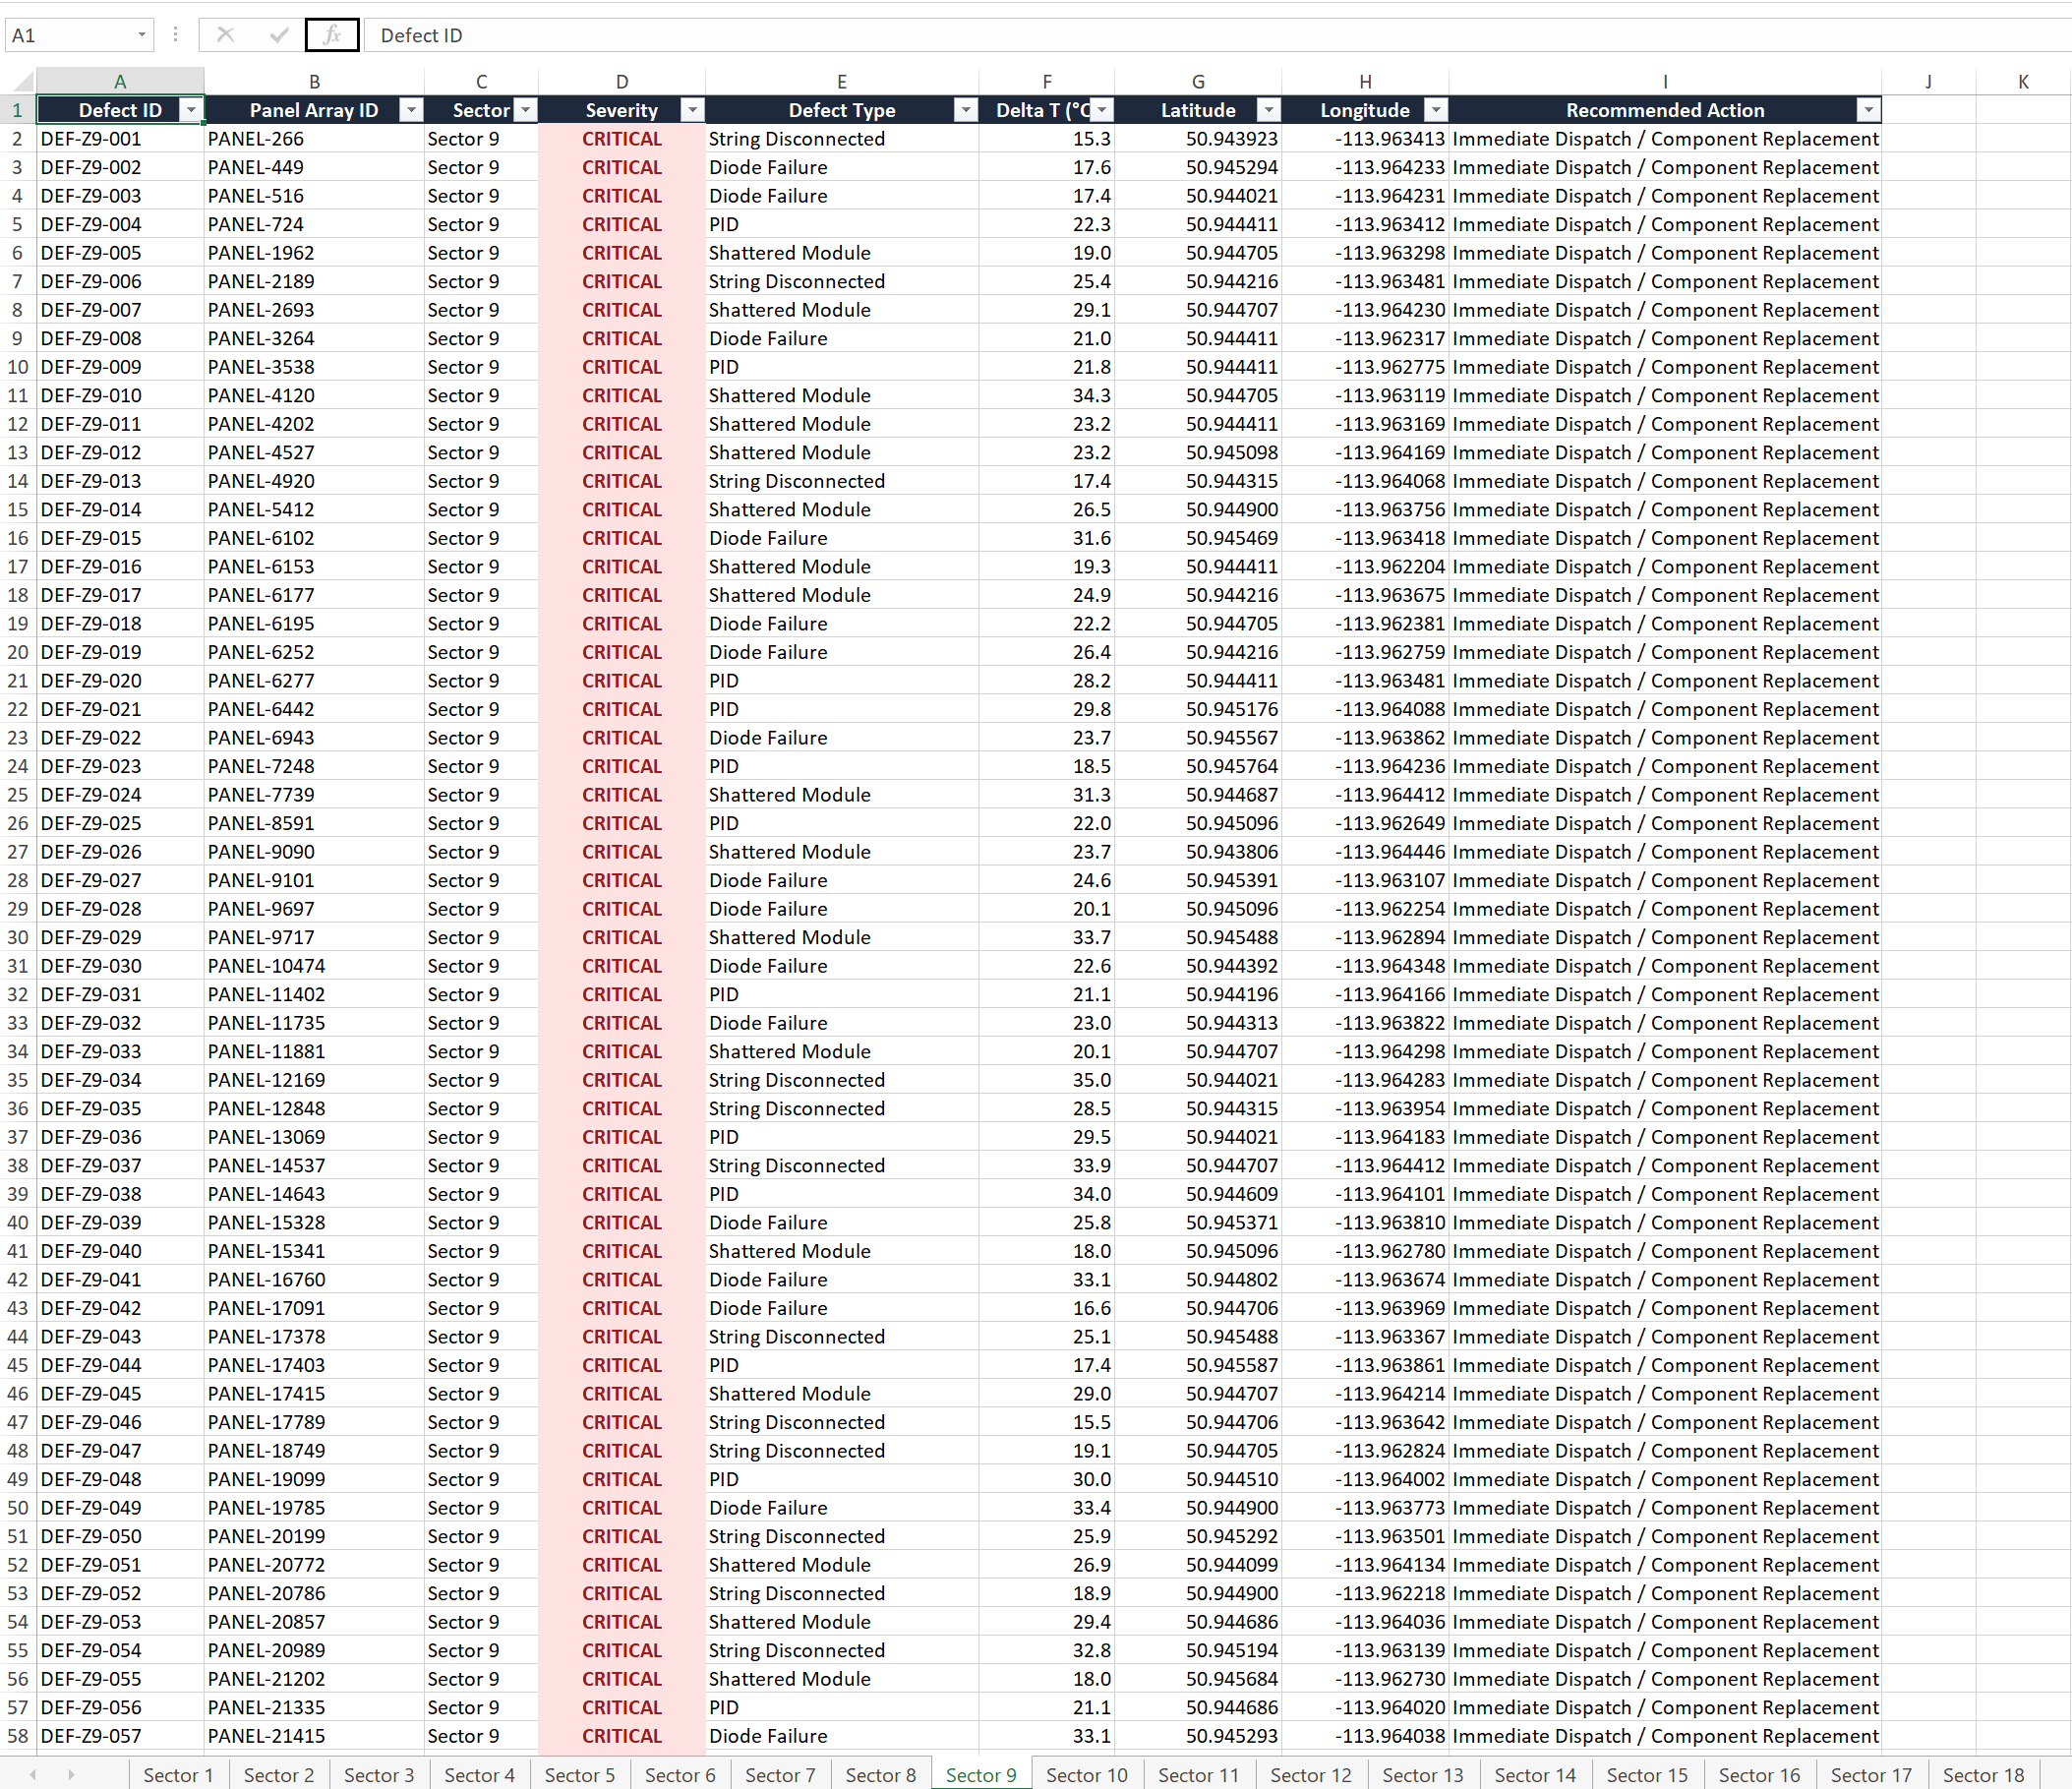
Actionable Defect Logs
For granular record-keeping, download comprehensive, sector-organized spreadsheets. Every fault is cataloged with precise GPS coordinates, severity rankings, thermal metrics, and recommended actions.
- • One-click .xlsx exports
- • Granular, sector-by-sector data
From raw imagery to resolved tickets — autonomously.
Valorin ingests every inspection signal you collect, runs them through a fleet of specialized AI agents, and hands your O&M team a prioritized queue. No more spreadsheets, no more guesswork.
Multi-modal fault detection
Thermal hotspots, EL cracks, PID, soiling, snail trails, diode failures — detected from drone, satellite, and IV-curve data in a single pipeline.
AI agent triage
Agents rank every anomaly by yield impact, repair cost, and warranty status — so your team always works the highest-ROI ticket first.
Auto-generated work orders
Each detection becomes a routed ticket with GPS pin, panel ID, recommended fix, and parts list — pushed straight to your CMMS.
Performance forecasting
Model the dollar impact of every fault. See projected MWh recovery before you send a crew — and prove ROI after.
Warranty claims, automated
Valorin assembles claim packages — module IDs, EL imagery, IV curves, install records — ready to submit to manufacturers.
Fleet-wide intelligence
Compare degradation rates across sites, modules, and inverters. Spot bad batches before they tank your portfolio.
Whoever owns the uptime number.
Independent power producers
Track degradation across hundreds of sites. Catch underperformers before they affect PPA delivery.
O&M service providers
Run more sites with the same headcount. Valorin does the triage; your crews do the work that matters.
Asset owners & investors
Independent verification of fleet health. Clear visibility into where yield is leaking — and what to do about it.
Stop losing yield to faults you can't see.
Tell us about your fleet. We'll show you what Valorin can find.